Practice Reports
Video tutorial
Running a dental practice efficiently depends on having quick access to the right information. DentalPlus offers a range of reports designed to help you track patient activity, manage finances, and keep day-to-day operations on track. Watch DentalPlus Video

DentalPlus Reports
The Reports in the system are organised into five categories, each containing a range of reports designed to support different areas of practice management. These categories cover everything from appointments and treatments to finances, recalls, and patient activity. Each report provides detailed, actionable insights that help dental teams monitor performance, track progress, and make informed decisions to improve efficiency and patient care
| Appointments Reports | |
|---|---|
| Appointments at status | The Appointment Status Report lists the details of each appointment scheduled for one or more clinicians on a specific day. This report is useful for checking the status of upcoming and past appointments and defining cancelled and deleted appointments. |
| Appointments by Reason | The Appointment by Reason Report lists the details of each appointment scheduled for one or more clinicians on a specific day filtered by reason. It also shows the status of the appointment if it was cancelled, deleted or rearranged. |
| Appointment counts | The report creates a summary table that counts the appointments by reason. |
| Standby List | This report is related to the patient's journey within the practice and displays the waiting times of the patients |
| Practice Recalls - Dentist | A list of patients who are due to be scheduled for a dentist recall. |
| Practice Recalls - Hygienist | A list of patients who are due to be scheduled for a hygienist recall. |
| Time spent with patients | Shows the amount of time clinicians spend with patients, based on recorded appointments. |
| Clinical Reports | |
|---|---|
| Clinical Notes | A list of patients and their clinical notes created within a selected date range. |
| Open Treatment Plans | Shows a list of patients with open treatment plans. |
| Financial Reports | |
|---|---|
| Daily takings | Shows the total amount of money received by the practice for a selected day or date range, broken down by payment method. |
| Allocated Takings | This report shows payments and their allocation to invoices within the selected date range. Pre-payments are also included if they have been allocated to an invoice during the selected period. |
| Debtors | This report shows patients who have an outstanding balance as of the selected date. |
| Creditors | Shows patients who have credit on their account on the selected date. |
| Patient Reports | |
|---|---|
| Patient list | Shows a list of all patients in the practice. You can filter the list by Clinician, Scheme, or Status.Leave the dates blank to see all patients, or select a date range to see new patients who joined during that period. |
| Not visited since before | Shows patients who have not visited the practice since their last appointment and do not have a more recent visit. A useful report for finding patients who have not returned to the practice and reminding them about their dental care or treatment. |
| Birthdays | Shows patients who have a birthday within the selected date range. It can be used to send birthday messages or invitations to patients. |
| Referring Dentists | Shows patients referred by a dentist, using the Referring Dentist field in the patient details. The date filter is based on the date the patient joined the practice. |
| New patients | Counts patients who joined the practice during the selected date range. |
| Referring Practices | Shows patients count referred by a specific practice |
| Invalid Email addresses | Shows patients with invalid or incorrect email addresses in their records. |
| Blocked Patients | Shows patients who are blocked in the system. |
Browse reports
Under this tab, users may generate a variety of reports which provide detailed, actionable insights that help dental teams monitor performance, track progress, and make informed decisions to improve efficiency and patient care.
- Click the required report to display the available filters.
- Set the filters and generate the report.
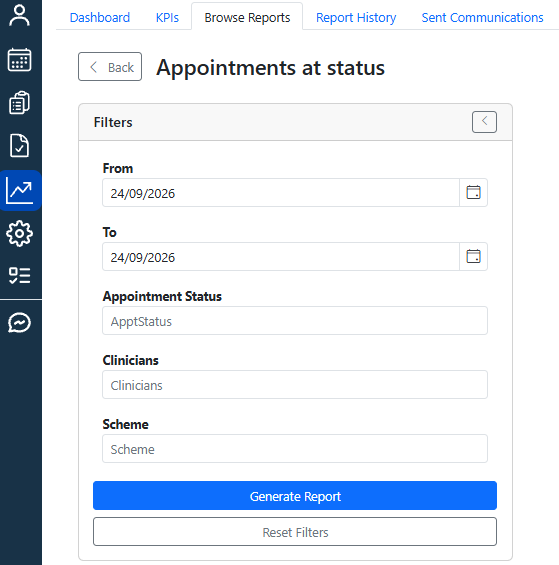
- The results will be displayed on the screen.
- From the results, you can:

- Print the report for further use
- Select patients from the list and send bulk communications using the Create Document functionality.
- Export results to Excel or CSV
To find reports more quickly, you can search by report name or use filters to narrow down the list. Add some reports to Favotites to access them with one click.
How to generate a report
- Go to
Admin → Reports → Browse Report. - Select the required report.
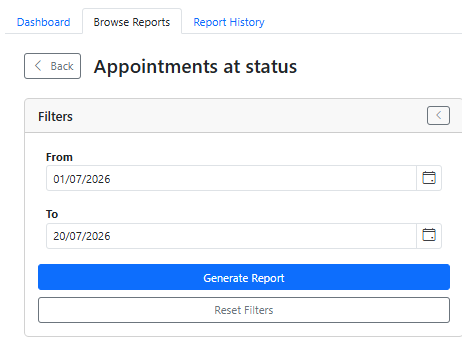
- Set the required filters. Available options may include:
- Date range (from and to)
- Patient schemes
- Clinicians
- Appointment or patient statuses
- Patient age
- Click Generate Report
-
The report results will be displayed on the screen.
-
They can be printed or used for mass marketing campaigns.

Filtering Report Data
The DentalPlus Reports section has got a multifunctional filtering tool. Users no longer need to set up filters before generating a report. Simply select the required date range and generate the report. After the results are displayed, use the filter options directly within the report to display the data.
Steps to Filter Report Data:
- Generate a report
- Use the column filters by clicking the filter icon next to the relevant column.

For example, you can apply the Status column filter to display: Booked – patients with future appointments, Exited – patients with past appointments
- Select the required options and click OK to apply the filter.
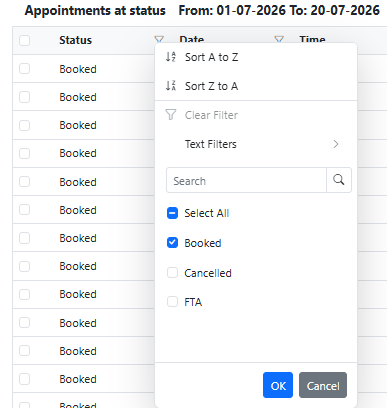
- The system will display the filtered data, which can be printed or used for mass marketing campaigns.
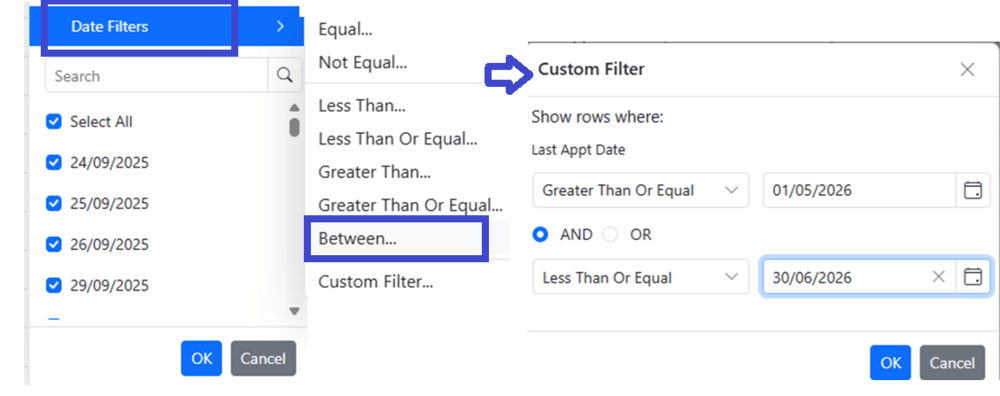
Applying a Date Filter: To display results for a specific date range:
- Click the Filter icon next to Last App Date.
- Select Date → Between.
- Enter the required dates, for example 1 May – 30 June.
- Click Apply to display only the results within the selected date range.
You can also click Sort By → Newest to change the order of the results.
How to print/download a report results
- Generate the required report.
- Click Print Report in the toolbar.
- The results screen will provide options to:
- Print the report
- Download the report
- Email the report

How to export result to Excel
You can export your report results to Excel for further review, filtering or editing.
- Generate the required report.
- Click Excel Export or CSV Export in the toolbar.
- Find results in the Downloads folder
How to add a report to favourites
- Go to
Admin → Reports → Browse Report. - Select the required report.
- Click Add to Favourites in the top-right corner.

- The report will appear in the Favourites section for quick access.
- To remove a report from your favourites, click Remove from Favourites.
Report History
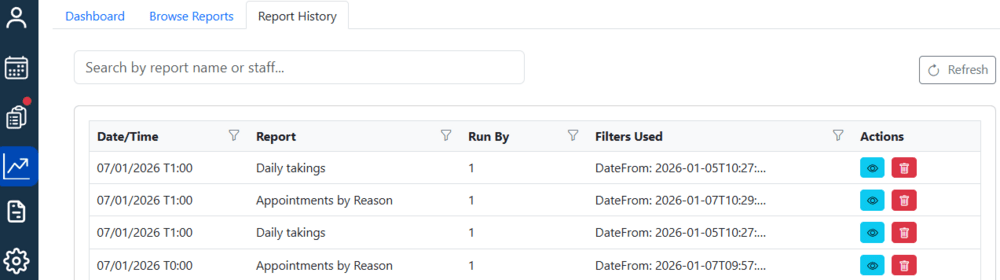
This tab contains data from previously run reports. Simply search for a report by name, click the eye-icon to view the results, or delete it if necessary.
Sent Communications
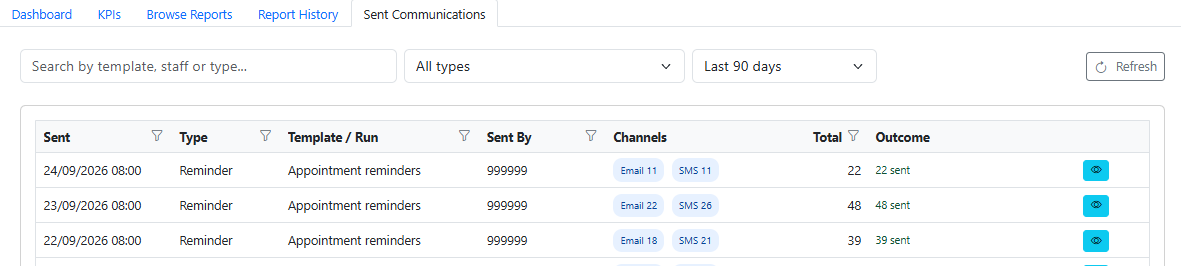
This screen shows a record of all bulk communications sent from the system, including automatic communications and bulk communications created by users using report data.
You can see:
- Date sent
- Template used
- Created by
- Communication method
- Number of patients contacted
Click the eye icon to view the full details.