The Dashboard and KPIs
The tab displays real-time graphs and figures, giving you a quick view of today’s activities, including treatments performed and takings received.
The Dashboard
The Reports Dashboard gives a quick overview of what is happening in the practice. You can access it from the main left-hand menu by clicking Reports.

The dashboard displays real-time figures and graphs, helping you quickly see key information such as:
- Today’s treatments and activity
- Today’s takings
- Practice activity and performance
- Useful figures to help you monitor how the practice is doing
Access to this section is controlled by user permissions. By default, users with Level 4 or Level 5 permissions can access this section. An Admin user can change these permissions if required by going to: Admin → Practice Setup → Permission Levels
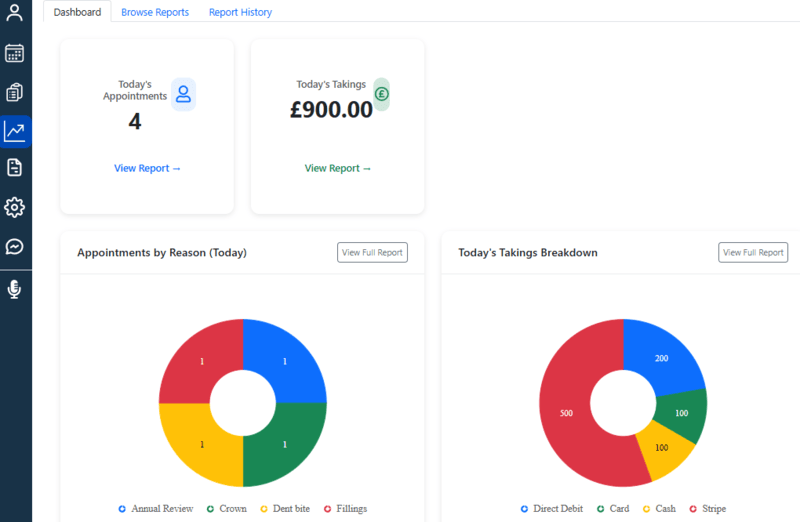
It is a quick way to check the most important information without running individual reports.
For more detailed information and additional reports, you can use the other options available in the Reports section.
KPIs
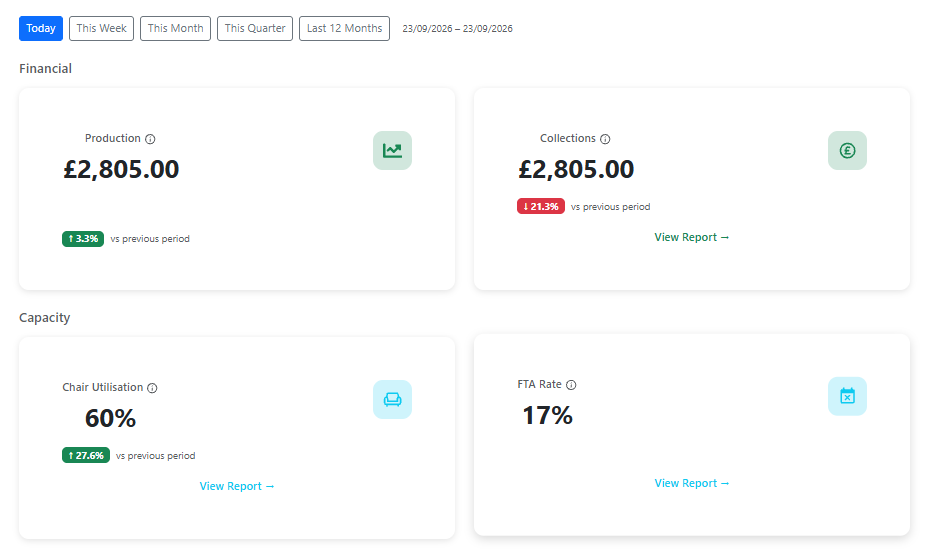
The KPIs Dashboard gives a quick overview of your practice using key performance indicators (KPIs).
Access to this section is controlled by user permissions. By default, users with Level 4 or Level 5 permissions can access this section. An Admin user can change these permissions if required by going to: Admin → Practice Setup → Permission Levels
- Production
Shows the total value of treatments produced by the practice during the selected period.
- Collections
Shows the total amount of money collected by the practice during the selected period.
- Chair Utilisation
Shows how effectively your available appointment time is being used. A higher percentage means that more of the available chair time has been booked and used for appointments.
- FTA Rate
This shows the percentage of appointments where patients did not attend and did not cancel in advance. Monitoring the FTA rate can help the practice identify attendance issues and review its reminder and confirmation processes.
- New Patients
Shows the number of new patients registered with the practice during the selected period. This can help you monitor how many new patients are joining the practice over time.